Category: Blog

  • What Is Drone Orthomosaic Mapping in Surveying?

    What Is Drone Orthomosaic Mapping in Surveying?

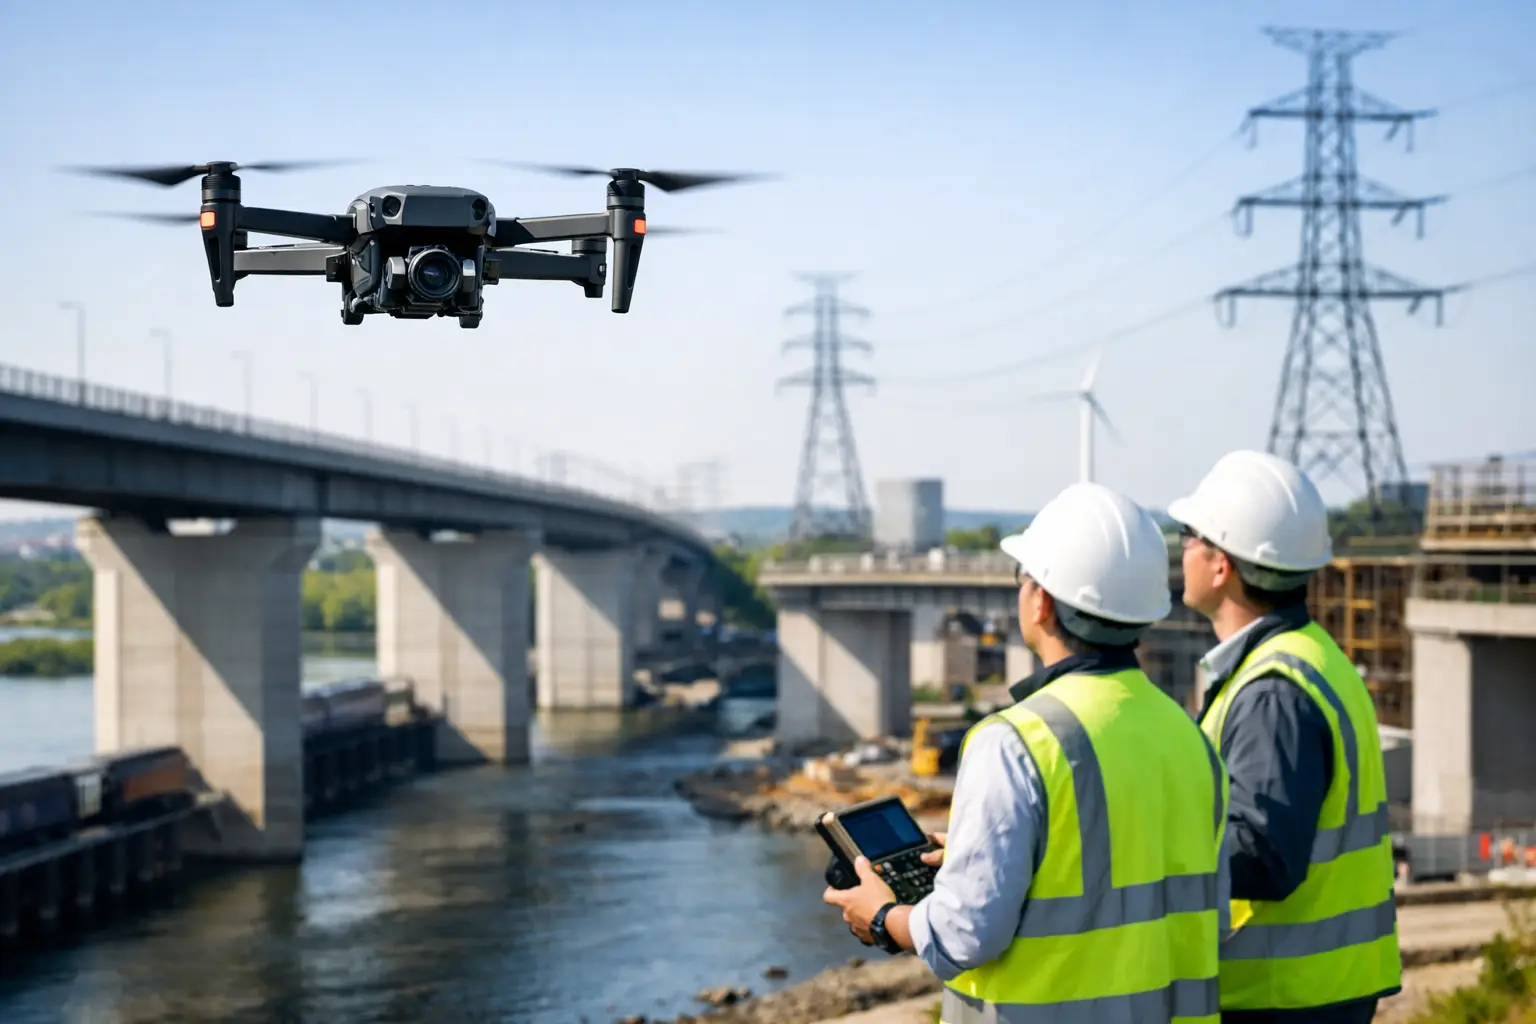
    A construction site can change materially in a matter of days. Stockpiles move, excavation advances, access routes shift and temporary works appear. What is drone orthomosaic mapping in this context? It is the process of producing one geometrically corrected, measurable aerial image from many overlapping drone photographs, creating a reliable visual record of the site at a defined point in time.

    Unlike a standard drone photograph, an orthomosaic is processed to remove the effects of camera angle, terrain variation and perspective. When captured and controlled correctly, it can be used within surveying, design, planning and asset-management workflows as a scaled map rather than simply an attractive aerial image.

    What is drone orthomosaic mapping?

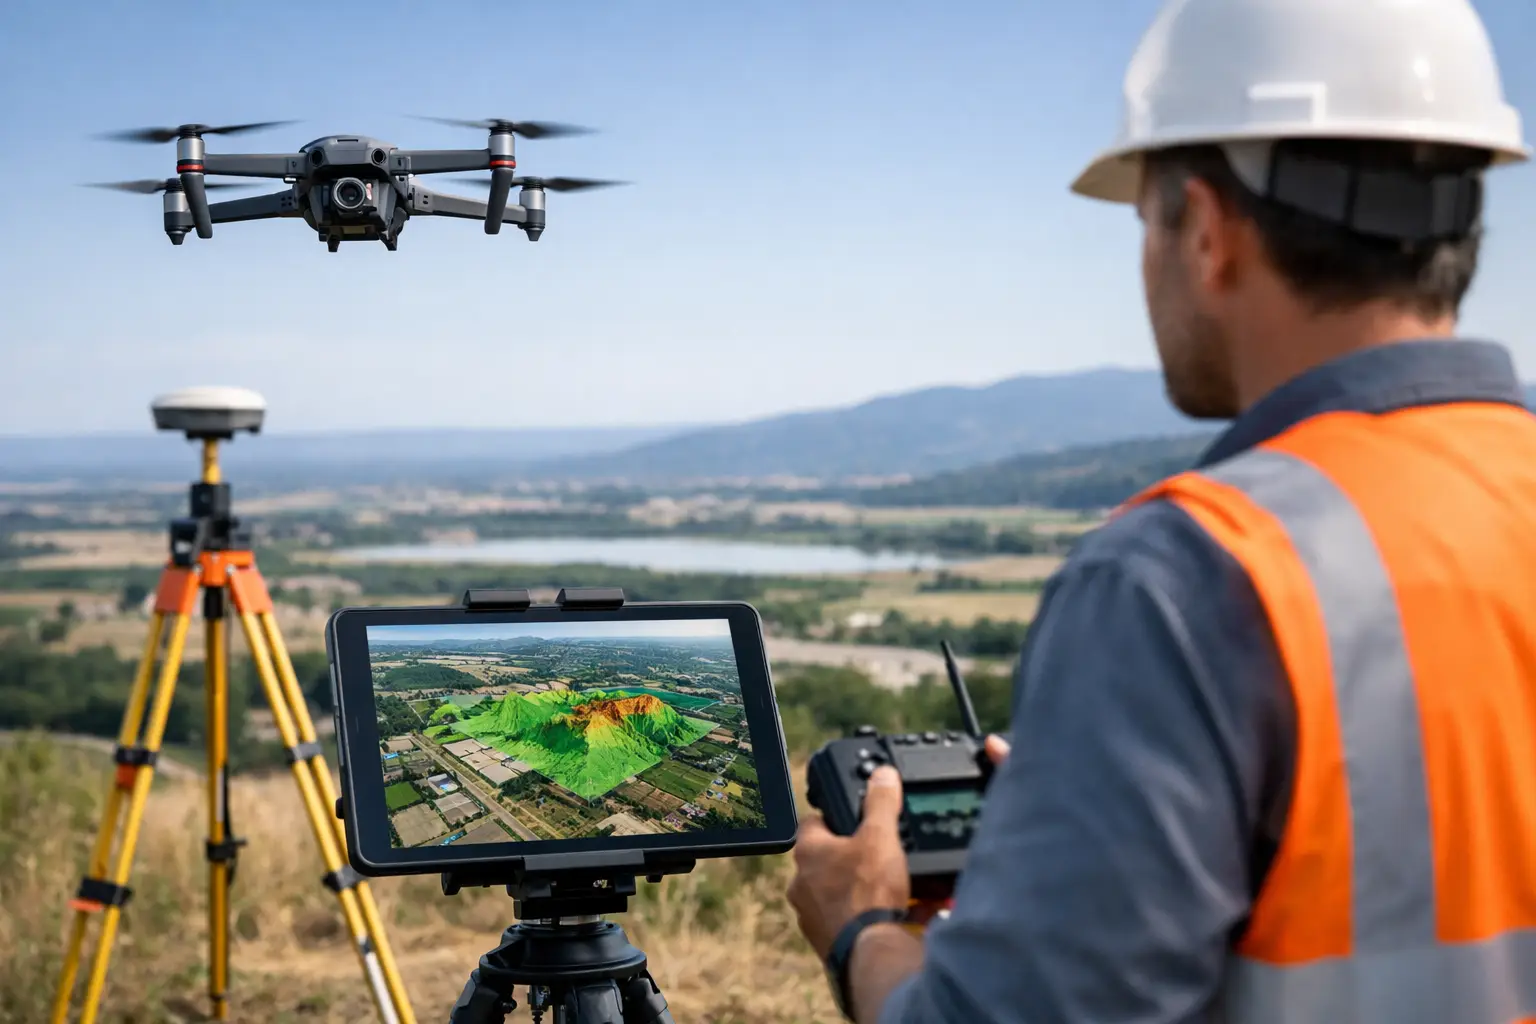
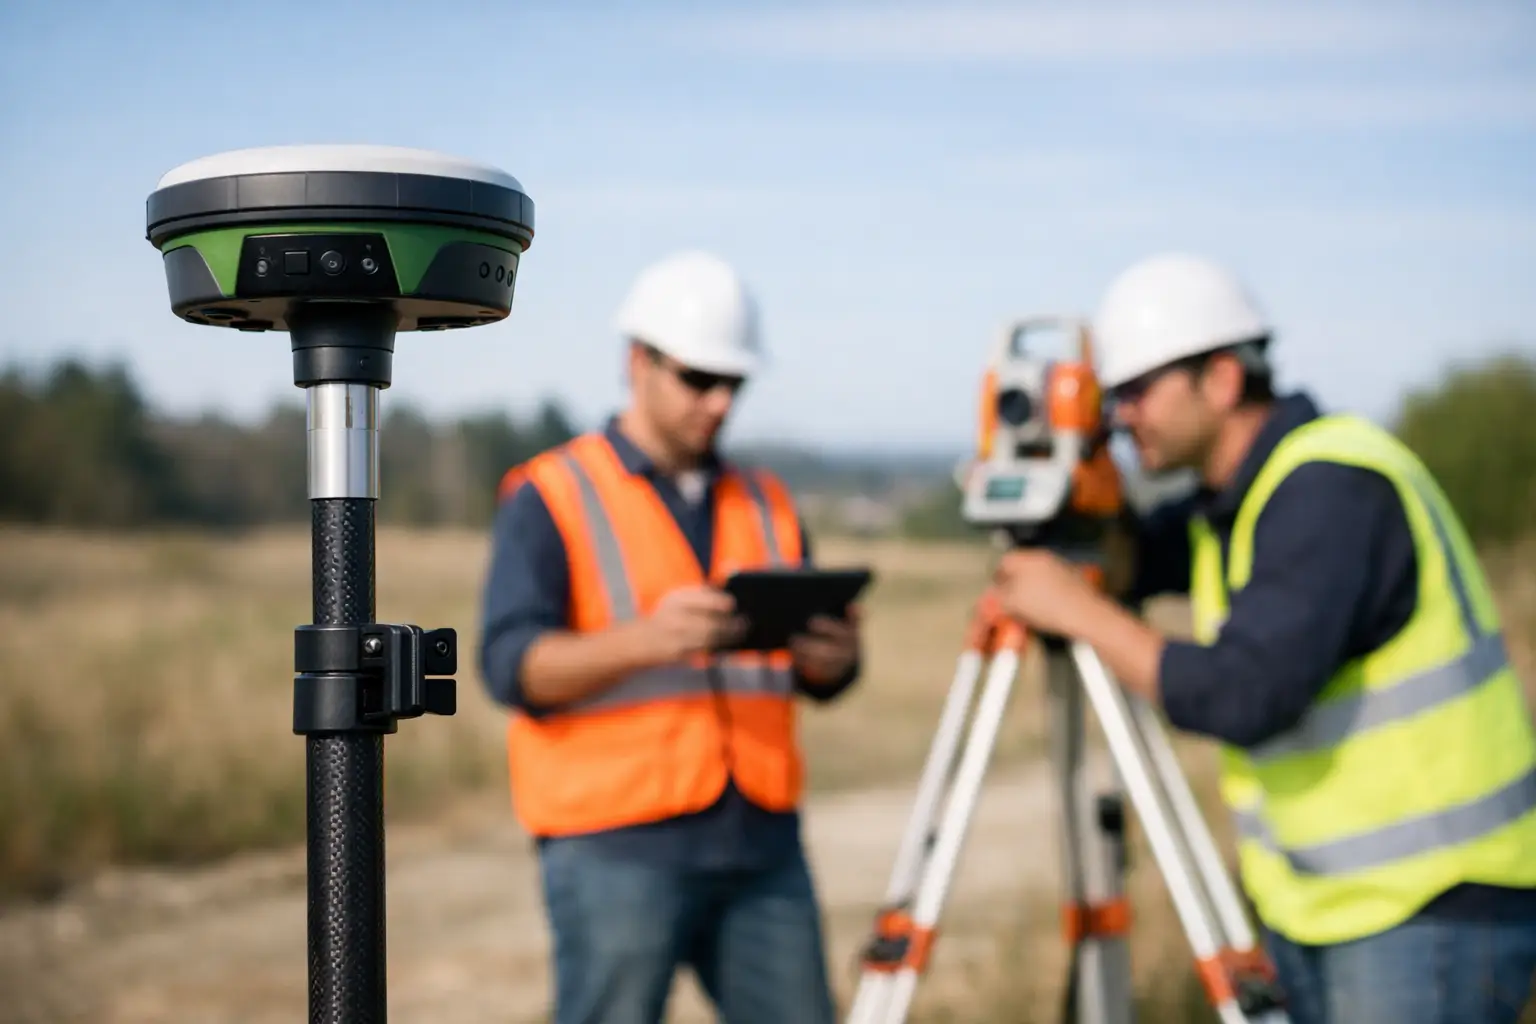
    Drone orthomosaic mapping combines photogrammetry, accurate positioning and image processing. A drone flies a planned mission over an area, taking hundreds or thousands of overlapping images. Specialist software identifies common points between photographs, reconstructs the scene and stitches the imagery into a single seamless map.

    The critical stage is orthorectification. Each image is adjusted using the camera model, flight position and elevation data so that features are represented in their correct ground position. The result is an orthomosaic: a top-down image in which distances, areas and coordinates can be measured.

    This makes orthomosaic mapping valuable where teams need a current, intelligible overview of a site without walking every metre of it. It is commonly used for topographic survey support, earthworks monitoring, construction progress, quarry and landfill management, agricultural assessment, drainage planning and inspection of large or difficult-to-access areas.

    How an orthomosaic is created

    A professional workflow starts before the drone leaves the ground. The required deliverable, site conditions, survey control, airspace constraints and desired accuracy must be established first. A visual progress record may need a different flight plan and control method from a CAD-referenced survey or a volumetric calculation.

    Flight planning and image capture

    The drone follows a repeatable grid flight at a selected height, typically collecting nadir imagery with the camera facing directly down. Images need substantial forward and side overlap so the processing software can match the same ground detail across multiple photographs.

    Flight height determines ground sampling distance, often called GSD. GSD describes how much ground each pixel represents. A lower flight produces finer detail, but it also increases the number of images, flight time and processing demand. The right balance depends on whether the priority is broad site coverage, feature identification or high-detail measurement.

    Lighting, wind, vegetation movement and surface texture also affect capture quality. Water, uniform sand, reflective roofs and dense foliage can be difficult for photogrammetry because there may be too little stable visual detail for reliable image matching.

    Positioning and survey control

    The drone’s onboard GNSS position provides a useful starting point, but it is not always sufficient for a survey-grade outcome. RTK or PPK drone workflows improve the accuracy of image geotags by applying correction data to the aircraft position.

    For projects requiring demonstrable positional accuracy, surveyors may also establish ground control points, or GCPs, across the site. These visible targets are measured using GNSS/RTK equipment and used to constrain the orthomosaic during processing. Independent checkpoints should then be used to verify the finished dataset rather than merely confirm the control used to create it.

    RTK does not automatically remove the need for ground control. On a straightforward, open site with an appropriate coordinate reference system and clear verification requirements, it may reduce the quantity of control required. Complex terrain, demanding specifications, poor satellite conditions or contractual survey tolerances can still justify a more rigorous control network.

    Photogrammetric processing

    Processing software aligns the imagery, calculates camera positions and produces a dense point cloud, digital surface model and orthomosaic. The output can be exported in common geospatial formats for use in GIS, CAD, modelling and reporting workflows.

    The processor must define the correct coordinate system and vertical datum. This is particularly important on UK projects, where data may need to align with the National Grid, site control or an established engineering coordinate system. A visually convincing map in the wrong coordinate reference system is not an effective survey deliverable.

    Why raw aerial images are not enough

    A single drone image is affected by perspective. Features nearer the edge of the image can appear displaced, and tall objects may lean away from the image centre. Measuring directly from that photograph can produce misleading results.

    An orthomosaic corrects these distortions as far as the source imagery, terrain model and control allow. Roads, kerb lines, roof edges and ground features are placed in a common map view, enabling area and distance measurements. It also gives project teams one detailed reference image rather than a folder of disconnected photographs.

    That distinction matters when data informs quantities, design decisions, payment assessments or compliance records. An orthomosaic can support these activities, but it should not be represented as a precise survey without appropriate control, verification and a clear understanding of its limitations.

    Accuracy: what can be expected?

    Orthomosaic accuracy depends on the entire workflow, not just the drone model. Camera quality, flight height, image overlap, RTK or PPK corrections, GCP distribution, terrain, processing settings and quality assurance all contribute to the final result.

    For well-planned professional projects using suitable equipment and robust survey control, centimetre-level horizontal accuracy may be achievable. However, a claimed accuracy figure should always state how it was tested, which reference system was used and whether it refers to control-point residuals or independent checkpoint accuracy.

    Vertical accuracy usually demands greater care than horizontal accuracy. Orthomosaics are primarily an image product, while levels and volumes are derived from the associated elevation model. Long grass, standing water, shadows and obstructions can reduce the reliability of the surface model. Where the requirement is to map bare earth beneath dense vegetation, drone LiDAR may be a more appropriate method than image-based photogrammetry.

    Typical professional applications

    On construction and civil engineering projects, regular orthomosaics provide a consistent visual record of progress. Teams can compare dates, identify changes, annotate issues and communicate site status to stakeholders without relying on ground photography alone. When combined with a surface model, the same capture can support cut-and-fill checks and stockpile volume calculations.

    For utilities and infrastructure operators, an orthomosaic can provide an accessible base layer for corridor planning, asset context and inspection preparation. It does not replace close-up inspection where condition detail is required, but it can reduce time spent identifying access routes, locating features and planning safe field activity.

    In agriculture and land management, high-resolution orthomosaics help document field boundaries, drainage features, crop variation and access conditions. RGB imagery has limitations for crop-health analysis, so multispectral sensors may be selected where the objective is vegetation indices rather than visual mapping.

    Heritage, estates and planning teams can use orthomosaic outputs to document sites before and after works, map roof or ground conditions, and provide clear evidence for consultation or design discussions. The benefit is not merely coverage. It is the ability to relate imagery to known coordinates and other spatial datasets.

    Choosing the right approach for the project

    Drone orthomosaic mapping is most effective when the specification begins with the business decision the data must support. If the need is a clear, repeatable site record, a standard RGB survey with reliable georeferencing may be suitable. If the output must integrate with engineering design, establish earthworks quantities or meet specified tolerances, survey control, verification and experienced data processing become essential.

    It is also worth considering whether photogrammetry is the right sensing method. Open ground, buildings, hardstanding and stockpiles are well suited to image-based mapping. Dense woodland, complex structures, featureless surfaces and areas where ground visibility is poor may require LiDAR, terrestrial scanning or a combined capture approach.

    A complete deliverable should define more than the image file. It should state the coordinate system, GSD, capture date, control method, accuracy assessment, exclusions and supplied formats. This gives survey, engineering and commercial teams confidence that the dataset is fit for its intended use.

    For organisations building an in-house workflow, the practical choice is not simply which drone to purchase. It is how aircraft, RTK corrections, ground control, processing software, operator competence and quality assurance will work together. LiDAR Tech UK can help define that workflow around the required accuracy, site conditions and final data outputs, whether the requirement is equipment supply, training or a delivered mapping service.

    The strongest orthomosaic is one that answers a specific site question with evidence the wider project team can trust.
  • A Guide to 3D Modelling from Point Clouds

    A Guide to 3D Modelling from Point Clouds

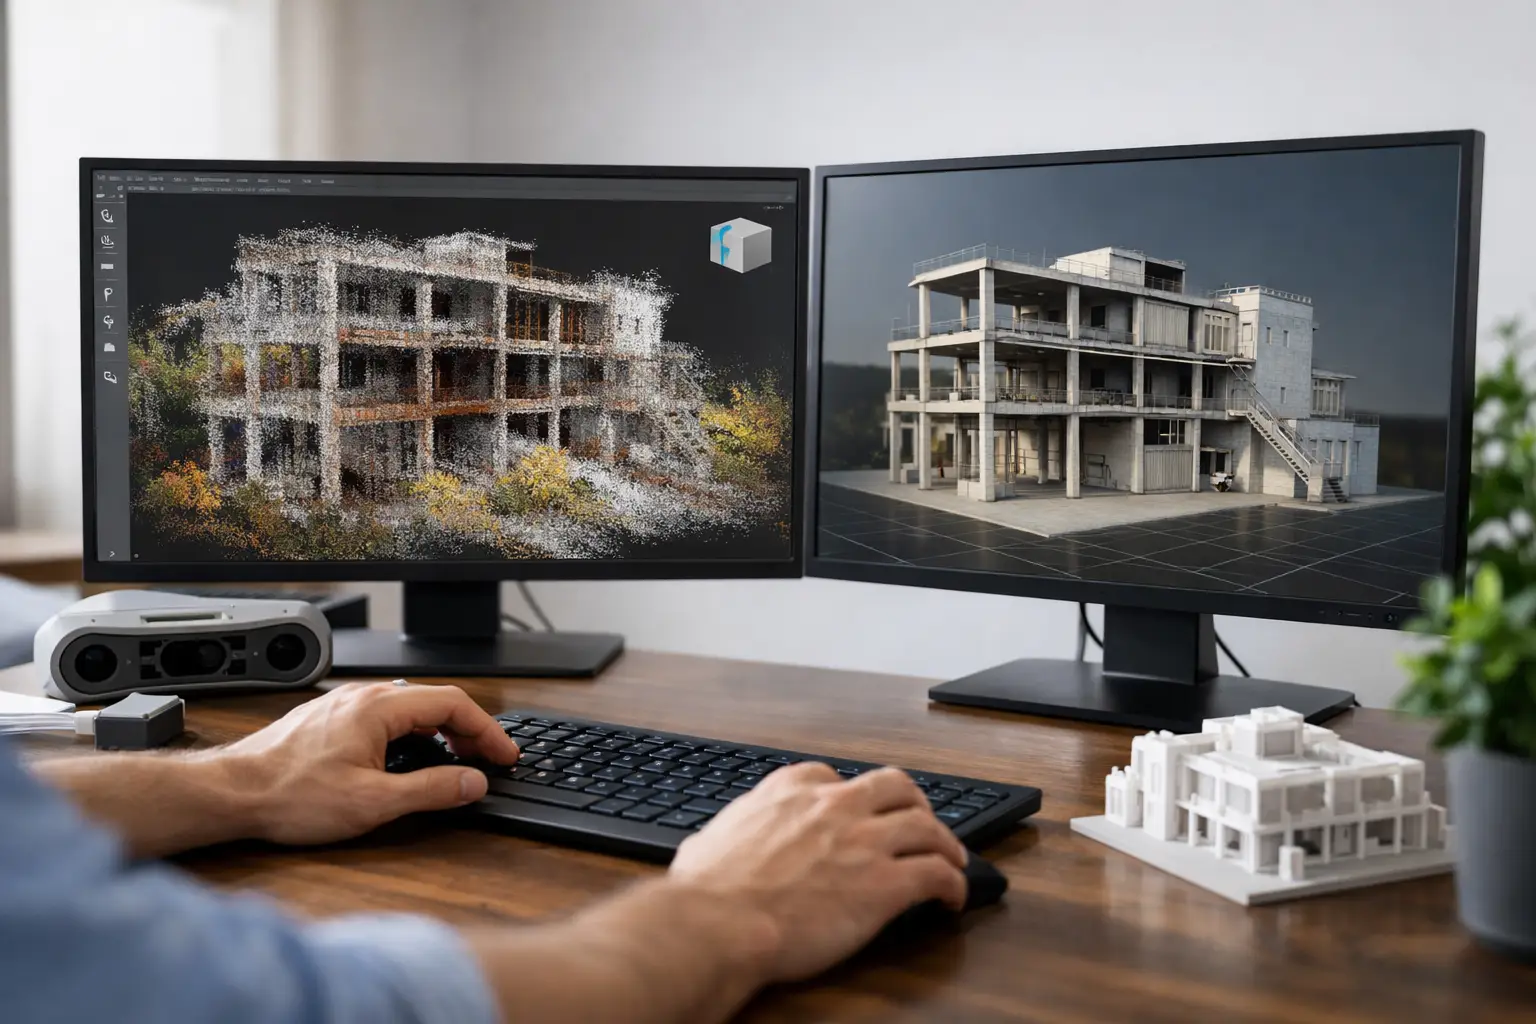
    A point cloud can record millions of measured positions in a matter of minutes, but it is not automatically a usable model. The value comes from converting that measurement-rich dataset into geometry that a design team, asset manager or contractor can interrogate with confidence. This guide to 3D modelling from point clouds sets out the workflow, decisions and quality controls that determine whether the final model is fit for purpose.

    Start with the required model, not the scan

    The most costly point-cloud modelling problems usually begin before the scanner is switched on. A detailed scan cannot compensate for an undefined deliverable. Before capture, establish what the model must support: measured surveys, clash coordination, refurbishment design, heritage recording, quantity planning, asset management or visualisation.

    That intended use sets the required level of detail, accuracy, coordinate reference and model format. A model for early-stage space planning may only need primary walls, floors, ceilings and structural openings. A fabrication or plant-room coordination model may require pipework, valves, cable containment, supports and equipment connections. Trying to model every visible item on every project adds cost, extends programme time and can make the file difficult to use.

    Agree the following at the outset: the survey control and coordinate system, required positional tolerance, modelled elements, exclusions, file formats, naming convention and the software environment in which the client will use the data. For UK construction work, this often includes a clear decision on whether the deliverable is a georeferenced survey model, a Revit model, CAD drawings, a mesh, or a combination of these outputs.

    Capture a point cloud that supports modelling

    A successful model begins with complete, well-registered data. Terrestrial LiDAR is generally the preferred choice for interiors, complex structures and plant areas because it captures dense geometry with controlled coverage. Mobile mapping can improve productivity across larger sites, while drone LiDAR or photogrammetry can capture roofs, facades, terrain and inaccessible external assets.

    Each approach has trade-offs. Static scanning offers high detail and dependable coverage but requires more station planning. Mobile scanning is faster, particularly along corridors or through large buildings, but depends on a disciplined walking route, suitable SLAM conditions and appropriate control. Drone capture reduces working-at-height exposure and provides valuable roof data, although vegetation, reflective surfaces and line-of-sight constraints still affect results.

    Plan scan positions around occlusions rather than simply working to a regular grid. Dense plant, suspended ceilings, racking, parked vehicles and open doorways can all hide important geometry. Where possible, capture overlapping views from different elevations and directions. Include survey control where project accuracy, repeatability or integration with existing design data demands it.

    Field checks are more efficient than return visits. Review coverage on site, confirm that key interfaces are visible, and identify whether surfaces such as glass, polished metal or dark finishes have produced poor returns. These materials can create holes, noise or false points, so important dimensions may need supplementary total-station observations or manual measurement.

    Registration and georeferencing

    Registration combines individual scans into one coordinated point cloud. The process may use cloud-to-cloud alignment, targets, surveyed control or a combination of methods. Registration reports are useful, but a low reported error alone does not prove a correct result. Repetitive spaces, long corridors and similar structural bays can permit a visually plausible but incorrect alignment.

    Check registration against independent control and inspect known features across scan boundaries. If the model must align with a site grid, engineering design or GIS dataset, establish that reference early. Retrofitting coordinates after modelling creates avoidable rework and can introduce uncertainty into every downstream drawing and schedule.

    Process the cloud without removing useful evidence

    Raw point clouds contain more than the permanent built environment. People, vehicles, temporary materials, rain, moving machinery and scanning artefacts all need consideration. Processing should remove irrelevant noise while retaining evidence needed for interpretation.

    The usual preparation sequence is registration, georeferencing, clipping, classification where appropriate, decimation for viewing, and export into the modelling environment. Maintain a secure copy of the original registered dataset. The source cloud is the survey record, while a cleaned working cloud is an efficient modelling reference.

    Decimation needs care. Reducing point density can make large datasets manageable in CAD or BIM software, but aggressive thinning may remove detail at corners, pipe runs, ornate features or thin structural members. It is often better to use a lighter cloud for general navigation and retain high-density clipped regions for detailed modelling.

    Colour imagery can assist interpretation, particularly where geometry alone cannot distinguish materials, services or labels. It should not, however, be treated as proof of concealed construction. A point cloud records visible surfaces. It does not show what is behind a wall, inside a duct, beneath insulation or below ground unless those elements were exposed and captured.

    Choose the right modelling method

    There is no single correct way to convert a point cloud into a 3D model. The appropriate method depends on the asset, required detail and expected use.

    For buildings and infrastructure, feature-based or parametric modelling is normally the most useful route. Operators trace and construct walls, slabs, beams, openings, MEP services and equipment as intelligent CAD or BIM objects. This produces a model that can support drawings, coordination, schedules and design development, but it requires interpretation. Existing buildings are rarely perfectly square, level or consistent, so forcing irregular surveyed geometry into idealised objects can conceal valuable information.

    Mesh modelling converts the visible cloud surface into connected triangles. It is effective for complex forms, heritage features, rock faces, facades and as-built visualisation. Meshes represent shape well but are less suited to editable construction objects, reliable schedules or design coordination. File sizes can also become substantial.

    Surface and solid modelling sits between these approaches. It can be suitable for industrial plant, tunnels, fabricated components and terrain where accurate geometry matters more than BIM intelligence. In practice, many projects benefit from a hybrid output: a clean mesh for complex geometry, supported by parametric objects for key building and asset elements.

    Model to the evidence, not to assumptions

    Modelled geometry should follow the point cloud within the agreed tolerance, while recognising the limitations of capture. Edges may be blurred by scan resolution, objects may be partially obscured, and soft or reflective surfaces can be unreliable. Where a feature is inferred rather than directly observed, record that limitation clearly.

    Avoid making walls artificially straight or pipework artificially circular simply because the authoring software prefers standard objects. For refurbishment and retrofit work, the deviation from nominal geometry is often precisely what the design team needs to understand. Equally, modelling every minor defect in an old wall may not improve a design model. The agreed specification should determine the balance between measured fidelity and usable geometry.

    Quality assurance for a dependable model

    Quality assurance should run throughout the workflow rather than being left to a final visual check. Compare model objects back to the point cloud from multiple viewpoints and use sections to inspect alignment at junctions, openings and service routes. Check dimensions against control measurements and focus attention on areas where design risk is highest.

    A practical QA review should confirm four things:

    • The model is correctly positioned, orientated and scaled within the agreed coordinate system.
    • Geometry follows the source data within the specified tolerance.
    • Required elements are present, consistently classified and named.
    • Exclusions, occluded areas and assumptions are documented for the receiving team.

    The tolerance must reflect both the capture method and the purpose of the deliverable. A model for general estate planning and a model used to prefabricate services cannot be validated against the same standard. Clear acceptance criteria protect the client and supplier by ensuring that accuracy claims are relevant to the project rather than presented as a generic headline figure.

    Deliver data people can use

    A technically accurate model can still fail commercially if it is difficult to open, too heavy to navigate or incompatible with the project workflow. Confirm software versions and exchange formats before production begins. Native BIM files may be required for authoring teams, while IFC can support broader coordination. DWG, DXF, OBJ, E57, LAS or RCP files may also be needed depending on whether the recipient requires drawings, geometry or the underlying survey record.

    Delivering the point cloud alongside the model gives designers a means of checking interpretation and reviewing areas that were intentionally excluded from modelling. A concise survey report should state the capture dates, equipment approach, control method, registration results, coordinate reference, model tolerance and known limitations. That information gives the model a defensible provenance when it is used months or years after the survey.

    File management matters on live projects. Use disciplined naming, issue status and revision control so that teams do not coordinate against an obsolete scan or superseded model. For large estates or infrastructure programmes, consider dividing data by building, zone, floor or asset group to maintain practical file sizes without losing spatial context.

    When specialist support adds value

    Point-cloud modelling combines survey control, scanning practice, processing expertise and an understanding of CAD or BIM deliverables. Organisations that scan occasionally may find that training and a repeatable internal workflow provide the best return. Those facing a time-critical refurbishment, high-risk plant area or one-off heritage survey may be better served by an outsourced capture-to-model service.

    LiDAR Tech UK supports both routes, supplying professional scanning systems alongside training, technical guidance and survey deliverables. The right choice depends on scan frequency, internal capability, required turnaround and the consequence of inaccurate data.

    The most useful next step is not to request a model at a vague level of detail. Define the design decision, inspection task or asset-management outcome it must support, then specify the evidence and tolerance required to support it. That gives the survey and modelling team a clear target, and gives every downstream user data they can rely on.

  • FJDynamics Trion P1 Review for Survey Teams

    FJDynamics Trion P1 Review for Survey Teams

    A conventional topographic survey of a busy plant room, wooded corridor or constrained structure can consume far more time than the final deliverable suggests. That is where mobile laser scanning earns its place. This FJDynamics Trion P1 review considers whether the system provides a practical route to faster, survey-grade reality capture for UK teams that need usable point clouds rather than impressive-looking field technology.

    The Trion P1 is not intended to replace every total station, GNSS rover or static terrestrial scanner. Its value is in the gap between those methods: capturing complex spaces quickly, safely and with a level of detail that supports measured surveys, modelling, inspection and asset documentation. For the right work, that can materially reduce time on site and limit the need for repeat visits.

    What the FJDynamics Trion P1 is designed to do

    The Trion P1 is a handheld SLAM LiDAR scanner designed to capture 3D point-cloud data while the operator walks through or around an environment. SLAM – simultaneous localisation and mapping – enables the scanner to estimate its own position as it builds a model of the surrounding space. This makes it particularly useful where satellite visibility is poor, sightlines are interrupted or setting out numerous survey stations would be inefficient.

    The system combines LiDAR measurement with visual data capture and can be used with RTK positioning where a coordinated result is required. In practical terms, an operator can capture internal areas, external façades, corridors, structures, earthworks, vegetation and site assets in a continuous walk-through workflow.

    Its appeal is straightforward: capture more context in less time than traditional point-by-point methods, then process the result into a registered, colourised point cloud for CAD, BIM, measurement or visual inspection workflows.

    FJDynamics Trion P1 review: field performance

    The P1 is at its best in environments that are geometrically complex but accessible on foot. Industrial facilities, heritage buildings, rail-side assets, construction progress surveys and woodland-edge mapping are all credible examples. In these settings, the ability to move continuously around obstacles is more valuable than a specification sheet alone suggests.

    For indoor capture, SLAM scanning removes the repetitive work of relocating a tripod-mounted scanner and establishing overlap between individual set-ups. A careful route through rooms, stairwells and corridors can produce a comprehensive dataset in a fraction of the time required by static scanning. It is also a useful safety advantage where access windows are short or an operational environment cannot be disrupted for long.

    Outside, the scanner can collect dense geometry around structures, stockpiles, excavations and assets. RTK integration is particularly relevant when the final point cloud needs to sit within a site grid or national coordinate framework. That said, satellite positioning should be treated as one component of survey control, not a substitute for a considered control strategy on high-accuracy projects.

    Published performance figures are useful as an indication of capability, but real results depend on surface reflectivity, scan route, operator technique, movement through the scene and the quality of the control used. Dark materials, glazing, standing water, narrow repetitive corridors and large areas with few distinguishing features can all make any mobile mapping workflow more demanding.

    Accuracy: suitable for which jobs?

    The Trion P1 can support centimetre-level point-cloud work when it is deployed correctly and processed with appropriate checks. That makes it a strong fit for measured building surveys, as-built documentation, asset inventories, progress capture, volumetric context and preliminary design data.

    It should not automatically be specified for every task that carries a survey tolerance. Where millimetre-level certainty is required – for example, precision setting out, deformation monitoring, legal boundary work or critical fabrication verification – conventional survey control and specialist measurement methods remain necessary.

    The sensible question is not whether SLAM LiDAR is accurate in isolation. It is whether its verified accuracy is appropriate for the project’s tolerance, deliverable and commercial risk. A competent workflow includes check points, overlap where practical and comparison against independent control before data is issued.

    Workflow and software considerations

    A scanner only creates value when its output can move efficiently into the client’s existing workflow. The P1 produces point-cloud data suited to downstream use in common CAD, BIM and point-cloud processing environments. Colourised capture can also improve interpretation when users need to identify equipment, finishes, structural elements or asset labels within a dense survey model.

    Processing time must be allowed for in programme planning. The walk is fast, but data still needs to be transferred, processed, reviewed and exported. A large, detailed capture may be completed in the field within an hour, yet the survey team must still undertake quality assurance before issuing a deliverable. Mobile mapping accelerates acquisition; it does not remove professional responsibility for validation.

    For organisations new to LiDAR, the most common bottleneck is not the hardware. It is establishing a repeatable process for naming projects, selecting scan routes, managing control, storing raw files, checking outputs and defining what the client actually needs. A full-resolution point cloud may be appropriate for a modeller, while a client managing facilities may benefit more from sections, floor plans, asset schedules or a simplified visual model.

    LiDAR Tech UK can support this wider implementation process, including equipment selection, training and data workflows, rather than treating the scanner as a standalone purchase.

    Where the Trion P1 offers the strongest return

    The commercial case for the P1 is strongest where survey time, access restrictions or site complexity are affecting delivery. It can reduce labour on site, improve the amount of captured context and provide a defensible record of conditions at a particular point in time.

    Construction teams can use it for progress records, verification of installed work and coordination against design models. Survey practices can use it to capture difficult interiors and external context before extracting conventional deliverables. Asset managers can document plant, structures and service corridors without relying solely on photographs and handwritten notes. Forestry and land teams can use mobile capture to complement GNSS and drone data where ground-level detail is needed beneath or alongside canopy.

    The system is also valuable for risk reduction. A comprehensive point cloud allows teams to revisit dimensions remotely, reducing the chance that a missing measurement results in another site visit. On facilities with restricted access, that saving can be significant.

    Limitations to consider before purchase

    A handheld LiDAR scanner is not a push-button replacement for survey experience. The operator needs to plan a route that preserves positional confidence, avoids excessive speed and maintains useful visual and geometric overlap. Returning to a known area, creating loops where possible and avoiding abrupt transitions between feature-poor spaces will generally support better SLAM results.

    Busy sites present another consideration. Moving people, vehicles and machinery can introduce transient data into the point cloud. Some unwanted points can be cleaned during processing, but it is preferable to plan capture around activity where possible. Rain, highly reflective surfaces and poor lighting for imagery may also affect the usability of certain outputs.

    Buyers should also assess total ownership requirements. This includes processing software, workstation capacity, operator training, field control accessories and the time needed to build internal confidence. The lowest initial hardware cost does not always create the lowest project cost if the team cannot consistently turn raw scans into dependable deliverables.

    Is the Trion P1 the right choice?

    The FJDynamics Trion P1 is a compelling mobile LiDAR option for professional teams that need to capture detailed 3D reality quickly across varied environments. Its strength is operational efficiency: it gives surveyors and project teams a practical way to collect rich spatial data in locations where static scanning is slow and conventional methods do not capture enough context.

    It is best viewed as part of a measured survey toolkit. Use it where its speed and coverage improve the job, support it with suitable control and quality checks, and retain conventional instruments for tasks that demand tighter tolerances. For businesses facing repeated demands for as-built data, asset records or complex-site capture, the real test is simple: if one complete walk-through can prevent a return visit, the P1 has already started to justify its place in the workflow.

  • Drone Photogrammetry Versus LiDAR: Which Fits?

    Drone Photogrammetry Versus LiDAR: Which Fits?

    A proposed route through dense summer vegetation, an earthworks stockpile requiring weekly volumes, and a heritage façade all call for aerial data – but not necessarily the same sensor. Drone photogrammetry versus lidar is not a question of which technology is better in general. It is a specification decision shaped by surface visibility, required accuracy, deliverables, programme, and the commercial cost of getting the wrong dataset.

    For UK survey, construction and asset-management teams, both methods can reduce time on site and improve coverage in difficult or hazardous areas. The distinction is in how they measure the environment and what they can reliably reveal.

    Drone Photogrammetry Versus LiDAR: The Core Difference

    Drone photogrammetry creates measurement from overlapping photographs. Processing software identifies matching points across many images, reconstructs the scene in three dimensions, and produces outputs such as orthomosaics, dense point clouds, digital surface models, meshes and textured 3D models. It performs best where surfaces are clearly visible and have sufficient visual texture.

    Airborne LiDAR uses laser pulses rather than image matching. A LiDAR sensor records the time taken for each pulse to return from a surface, while GNSS, RTK or PPK positioning and an inertial measurement unit establish the sensor’s position and orientation. The result is a georeferenced point cloud with direct range measurements.

    This difference matters most when the ground is hidden. Photogrammetry generally models the top of vegetation, whereas LiDAR can record multiple returns from foliage, branches and the ground beneath. It does not see through every canopy, but a sufficiently dense LiDAR survey often delivers a far more useful terrain model in woodland, scrub and overgrown corridors.

    Where Drone Photogrammetry Delivers the Strongest Value

    Photogrammetry is often the right commercial choice for open, visible sites. A planned flight can capture a large area efficiently, and the imagery itself becomes a valuable deliverable for teams that need an up-to-date visual record as well as measured data.

    On construction sites, quarries, landfill operations and open agricultural land, photogrammetry supports topographic mapping, progress monitoring and stockpile measurement. Orthomosaic imagery is particularly useful for communicating conditions to project managers, planners and clients who may not work directly in point-cloud software. A textured mesh can also provide an intuitive model for façade assessments, roofs, structures and heritage documentation.

    Image resolution can be extremely high when the drone is flown at an appropriate height with a suitable camera. That makes photogrammetry effective for documenting surface detail such as cracking, material changes, kerbs, drainage features and visible defects. However, visual detail is not the same as survey certainty. Poor image overlap, moving vegetation, reflective surfaces, repetitive patterns, shadows and low-light conditions can all reduce reconstruction quality.

    For measured outputs, RTK-enabled drones can improve positional consistency, but ground control and independent checkpoints remain central to a defensible workflow. Surveyors should assess final accuracy against the required specification rather than relying on a drone’s published positioning capability alone.

    When Airborne LiDAR Is the Better Survey Tool

    LiDAR earns its place where access, vegetation and geometry make image-based reconstruction less dependable. Linear infrastructure is a common example. Rail, highways, pipelines, transmission routes and watercourses often pass through vegetation and inaccessible terrain, where a ground-level digital terrain model is more valuable than an attractive aerial image.

    The technology is also well suited to complex industrial sites and structures with limited texture or demanding geometry. LiDAR point clouds can capture fine spatial form without depending on matching visual features from one photograph to the next. This can be advantageous around embankments, cuttings, bridges, retaining walls and assets with shaded or uniform surfaces.

    LiDAR is not a replacement for photographs. The point cloud may be colourised using an integrated camera, but it will not normally provide the same visual richness as a high-resolution photogrammetric orthomosaic or textured mesh. For condition reporting where visible surface appearance matters, imagery may still be required alongside laser data.

    LiDAR survey quality also depends on far more than the scanner’s stated range. Pulse rate, scan pattern, field of view, flight height, speed, overlap, GNSS corrections, IMU performance and processing all affect point density and positional confidence. Tree cover can reduce the number of ground returns, particularly in leaf-on conditions. A pre-survey assessment should establish whether the intended point density and ground classification result are achievable for the site.

    Accuracy Is a Workflow, Not a Sensor Claim

    Both approaches can support accurate, CAD-ready survey outputs when they are planned and controlled correctly. Neither should be selected from a headline accuracy figure in isolation.

    Photogrammetry has the advantage of producing large volumes of image detail, but its accuracy can be affected by camera calibration, image geometry and weak control. LiDAR offers direct distance measurements, yet it requires rigorous trajectory processing and calibration between the GNSS, IMU and scanner. In either case, poor GNSS correction data, unsuitable control distribution or inadequate validation can undermine an otherwise capable system.

    The practical question is not whether a platform can achieve a particular figure under ideal conditions. It is whether the complete field and processing workflow can meet the project’s required horizontal and vertical tolerances, with independent checks to demonstrate it.

    For many topographic and earthworks applications, a well-executed photogrammetry survey will meet the requirement at lower sensor cost. For vegetation-covered terrain or complex assets, LiDAR may prevent expensive follow-up visits and manual infill work. That can make the higher mobilisation cost the more economical decision.

    Compare the Outputs Before Choosing the Capture Method

    The required deliverable should lead the sensor decision. If the client needs a current, high-resolution map of an open site, an orthomosaic and surface model from photogrammetry may be ideal. If they need levels beneath scrub for a design model, a classified LiDAR point cloud and digital terrain model are more likely to be fit for purpose.

    For asset inspection, the answer may be a combined workflow. Photogrammetry can provide visual context and a detailed textured model, while LiDAR supplies reliable geometry for clearance analysis, deformation assessment or integration with existing engineering datasets. The same principle applies to heritage work, where texture, colour and accurate form can all matter.

    Ask early whether the output must be a point cloud, contour plan, digital terrain model, digital surface model, mesh, orthomosaic, volume report or CAD drawing. Also establish coordinate system requirements, classification standards, expected point density, tolerances and the software environment in which the client will use the data. These decisions prevent a technically impressive survey from becoming an operationally awkward deliverable.

    Cost, Speed and Site Conditions

    Photogrammetry systems are typically more accessible to deploy, and data capture can be rapid over open ground. Processing can be computationally intensive, especially for dense reconstructions, but the workflow is familiar to many survey and construction teams.

    LiDAR payloads carry a higher equipment and processing cost, and specialist capability is needed to manage trajectory quality, calibration and classification. However, the field programme may be substantially shorter than a conventional survey where terrain is unsafe, steep, obstructed or heavily vegetated. LiDAR can also reduce the need to return when the initial requirement is a terrain model rather than a surface model.

    Weather and operating conditions influence both methods. Photogrammetry relies on usable light and stable imagery, so shadows, low sun, rain and wind deserve careful consideration. LiDAR is less dependent on daylight, but rain, mist and wet surfaces can affect returns and data quality. Safe flight planning, airspace checks, competent operators and appropriate permissions remain non-negotiable for either method.

    A Practical Specification Approach

    Start with the site, not the aircraft. Open ground with a need for visual reporting points towards photogrammetry. Vegetated terrain, corridor mapping and ground-model requirements point towards LiDAR. Where the project needs both visual interpretation and precise geometry, specify the two datasets together rather than forcing one sensor to do both jobs.

    LiDAR Tech UK supports professional teams with enterprise drone systems, LiDAR and photogrammetry workflows, positioning equipment, training and survey deliverables. The useful conversation is not simply which payload to buy. It is how to build a repeatable capture-to-output process that meets the accuracy, programme and commercial demands of your work.

    Before the next survey is commissioned, define the decisions the data must support and validate the proposed method against a representative site condition. That small step is often what separates a fast flight from a dependable survey result.

  • Can LiDAR Scanning Replace Total Stations?

    Can LiDAR Scanning Replace Total Stations?

    A survey team setting out steelwork, boundaries or precise drainage levels needs defensible control at known points. A team documenting a congested plant room, carriageway corridor or heritage façade needs complete spatial coverage before site access changes. Those are different capture problems, which is why the question, can LiDAR scanning replace total stations, has no single yes-or-no answer.

    LiDAR can reduce field time dramatically and deliver a far richer record than measured points alone. Total stations remain exceptionally effective where millimetre-level point accuracy, setting out, or tightly controlled observations are the priority. For many UK projects, the most productive approach is not replacement but a combined workflow: establish control with GNSS and/or a total station, then capture the wider environment with LiDAR.

    Can LiDAR scanning replace total stations on every job?

    No. LiDAR scanning can replace a substantial proportion of conventional total station observations on as-built, topographic, asset and reality-capture work, particularly where thousands of points would otherwise be measured individually. It does not automatically replace the survey control, verification and precise set-out functions a total station performs.

    A total station measures discrete points with a known instrument position, a controlled backsight and a clear line of sight to the prism or reflectorless target. It is designed for repeatable, high-precision coordinate work. This makes it well suited to construction setting out, deformation monitoring, boundary evidence, precise rail and highway observations, and detail surveys where individual features must be measured to a stated tolerance.

    LiDAR measures large numbers of points rapidly to create a point cloud. Mobile, handheld and terrestrial systems can record floors, walls, kerbs, structures, vegetation and complex assets in a single pass. The result is not merely a list of surveyed coordinates, but a spatial dataset that can be revisited in processing. That difference changes the value of the survey, especially when the client may later ask for additional sections, elevations, clearance checks or BIM content.

    The key distinction is simple: total stations excel at controlled, precise points; LiDAR excels at efficient, comprehensive context.

    Where LiDAR delivers a clear operational advantage

    LiDAR is particularly compelling when site conditions make point-by-point measurement slow, disruptive or unsafe. A scanner can capture a dense record of an industrial facility, stockpile yard, road corridor or existing building in minutes or hours rather than days of selective observations. It can also reduce the need for return visits when a missed feature becomes relevant during design.

    For as-built surveys, refurbishment planning and clash investigations, point-cloud coverage is often more valuable than a limited set of conventional shots. Design teams can inspect dimensions remotely, extract profiles and generate 2D drawings or 3D models from the same dataset. Facilities and asset-management teams gain a visual record that supports future maintenance, rather than a drawing showing only what was requested at the time.

    LiDAR also improves access to areas that are difficult to measure safely. This includes high-level structures, congested service areas, unstable ground, live operational sites and locations with restricted working windows. It does not remove the need for a safe system of work, but it can reduce exposure by limiting the time operators spend close to hazards.

    Speed is not only about field capture. A well-planned LiDAR workflow can shorten the path from site visit to deliverable because the source data supports multiple outputs. Topographic plans, orthographic imagery, elevations, mesh models, volumes and CAD-ready feature extraction can be produced from a common controlled dataset. The saving is strongest where the alternative would involve returning to site to collect more detail.

    Accuracy depends on the system and the workflow

    It is misleading to compare LiDAR and total stations by quoting one generic accuracy figure. Accuracy depends on the scanner, range, scanning method, GNSS correction quality, control layout, environmental conditions, registration process and quality assurance procedures.

    A total station used correctly can provide very high accuracy for individual points. It remains the preferred instrument where project tolerances are at the millimetre level or where legal, contractual or engineering controls demand a traceable observation process. On construction sites, it is indispensable for setting out positions, lines, levels and reference marks.

    Modern LiDAR systems can achieve highly useful survey-grade results, but field claims must be assessed against the required deliverable tolerance. A handheld SLAM LiDAR scanner, for example, can collect extensive data quickly indoors or beneath canopy where GNSS is unavailable. However, cumulative drift, limited loop closure, reflective surfaces, feature-poor corridors and poor route planning can affect the final cloud. Ground control and independent check points are therefore essential when coordinates and accuracy matter.

    Terrestrial laser scanners can offer stronger geometric performance for static work, while mobile LiDAR offers excellent productivity over larger or more complex sites. Drone LiDAR can add efficient coverage across corridors, embankments, quarries, woodland and inaccessible terrain, provided flight planning, control and classification are managed properly. Each method has a role, but none should be selected on headline specification alone.

    Control turns fast capture into reliable survey data

    Control is the bridge between LiDAR productivity and professional survey deliverables. A project may begin with GNSS/RTK observations to establish site control, followed by total station work where GNSS visibility is poor or tighter local precision is needed. The LiDAR data can then be registered to that control and tested against independent check points.

    This approach gives the client both coverage and confidence. It also creates a transparent quality process: known control coordinates, documented residuals, check-point results and a stated datum, projection and height reference. For engineering and construction users, those details matter more than a visually impressive point cloud.

    Where total stations remain the better choice

    There are applications where a total station should remain the primary tool. Construction set-out is the clearest example. Setting bolt positions, pile locations, kerb lines, structural grids and finished levels requires precise transfer of design coordinates to the ground. LiDAR can verify the completed work, but it is not normally the first choice for placing it.

    Monitoring is another. When movement must be detected over time, consistent observations to prisms or defined targets provide a controlled and repeatable method. LiDAR can identify wider surface change and deformation patterns, but total stations offer a stronger route for high-precision target monitoring.

    Small surveys can also favour conventional methods. If a surveyor needs ten accurately located points around a straightforward feature, opening a scanner, planning a capture route, registering data and processing a cloud may not be more efficient. The right tool is the one that produces the required answer with appropriate certainty and cost.

    Line-of-sight constraints still apply to LiDAR. The scanner cannot record what the laser cannot reach. Dense vegetation, parked vehicles, machinery, stored materials and occluded building features create gaps. Multiple scan positions or passes improve coverage, but they add capture and processing time. Total station observations can sometimes target a specific accessible point more directly.

    Selecting the right workflow for UK survey projects

    The starting point should be the deliverable, not the instrument. Ask what the client needs to make a decision: a setting-out coordinate, a topographic plan, a measured building survey, a volume calculation, a 3D model, or an enduring asset record. Then define the tolerance, coordinate reference system, site constraints and programme.

    LiDAR is usually the stronger primary capture method when completeness, speed and repeat use of the data are valuable. It is highly effective for existing-condition surveys, property and heritage documentation, MEP coordination, utilities environments, infrastructure assets, stockpile volumes and complex topography. A total station remains central when discrete precision, set-out or formal control observations drive the scope.

    Many organisations now benefit from equipping field teams with both capabilities. A GNSS/RTK rover provides rapid control and open-sky positioning. A total station supports precise local observations and set-out. LiDAR captures the detail between those control points at scale. This integrated method reduces manual observation time without weakening survey discipline.

    The processing workflow deserves equal attention. Point-cloud registration, cleaning, classification, georeferencing and feature extraction require competent operators and software suited to the intended output. A poor registration can undermine an otherwise excellent capture, while an unverified cloud can create false confidence. Training, field procedures and quality checks should be included in the equipment decision, not treated as an afterthought.

    A practical decision for survey and construction teams

    LiDAR should not be bought as a total station substitute simply because it is faster. It should be adopted where richer site data, reduced access time and repeatable digital deliverables improve the commercial outcome. Conversely, relying on LiDAR alone for millimetre-critical set-out or monitoring can introduce unnecessary risk.

    LiDAR Tech UK helps organisations assess the right mix of LiDAR scanning, GNSS/RTK and conventional survey control for their working environment and required outputs. The most effective deployment begins with a representative site and a clear accuracy test, rather than an assumption based on a brochure specification.

    For your next project, define the tolerances and deliverables first, capture independent check points from the outset, and choose the technology that gives the field team enough control as well as enough coverage.

  • Best Drone Payloads for Inspections in the UK

    Best Drone Payloads for Inspections in the UK

    A drone platform is only as useful as the sensor it carries. For a roof survey, a high-resolution visual camera may be sufficient. For an overheating substation component, thermal sensitivity matters more. For a rail corridor, stockpile or complex structure where accurate dimensions are required, LiDAR or survey-grade photogrammetry may be the deciding factor. Selecting the best drone payloads for inspections starts with the defect, measurement or deliverable your team needs to identify.

    For UK infrastructure, construction, utilities and asset-management teams, the right payload reduces time at height, limits site access requirements and produces defensible records for maintenance planning. The wrong choice can create attractive imagery that does not answer the engineering question. Payload selection should therefore be tied to inspection criteria, required accuracy, operating environment and the software workflow used after the flight.

    The best drone payloads for inspections by application

    Thermal and zoom payloads for asset condition surveys

    A combined thermal and optical zoom payload is often the most commercially effective option for general infrastructure inspections. It allows the pilot to locate an anomaly thermally, then confirm its physical condition with a detailed RGB image from a safe standoff distance.

    This combination is particularly useful for electrical assets, solar farms, roofs, façades, telecoms masts and industrial plant. Thermal imaging can reveal temperature differences associated with loose electrical connections, failing PV modules, blocked pipework, moisture ingress and insulation defects. Optical zoom then provides evidence of corrosion, damaged fittings, missing fixings or surface degradation without positioning the aircraft close to the structure.

    The DJI Zenmuse H30T is an example of an enterprise inspection payload designed around this requirement. It combines high-resolution thermal imaging with a wide camera, zoom camera and laser rangefinder in one unit. Its long-range visual capability supports inspections where close approach would be inefficient or unsafe, while the laser rangefinder helps operators establish the position and distance of a point of interest.

    Thermal results need careful interpretation. Reflections, solar loading, wind, emissivity and viewing angle can all affect apparent temperatures. A thermal payload is highly capable, but it should support a defined inspection method rather than replace engineering judgement. Repeatable flight timing, appropriate thermal settings and clear acceptance criteria are essential where results will inform maintenance decisions.

    High-resolution visual cameras for close visual inspection

    For assets where the objective is to document visible condition, a high-resolution RGB camera is usually the correct starting point. These payloads are suited to building envelopes, bridges, towers, roofs, heritage structures, quarries and general construction quality checks.

    The key specification is not megapixels alone. Useful inspection imagery depends on sensor size, lens quality, optical zoom, stabilisation and the ability to hold a consistent viewing angle. A camera that captures sharp detail from a sensible stand-off distance is more valuable than one that demands close flight around complex steelwork or fragile structures.

    Full-frame photogrammetry payloads, such as the DJI Zenmuse P1, are intended primarily for high-accuracy mapping and modelling rather than live defect inspection. However, they can be highly valuable when an inspection project requires a detailed, measurable visual record of a large asset. Captured imagery can support orthomosaics, textured 3D models and repeat surveys, allowing teams to compare condition across project stages or inspection cycles.

    For smaller sites and rapid-response work, an integrated enterprise camera drone may be more practical than a larger interchangeable-payload platform. The DJI Mavic 3 Enterprise range, for example, gives teams a compact route to visual documentation and mapping. The trade-off is payload flexibility: an integrated system cannot be reconfigured for every specialist sensor requirement.

    LiDAR payloads for geometry, clearance and inaccessible detail

    LiDAR is the preferred payload type when the inspection question depends on geometry rather than surface appearance. It measures large numbers of points in three-dimensional space, producing an accurate point cloud that can be used to model structure, quantify clearance, assess deformation and document difficult terrain.

    A drone LiDAR payload such as the DJI Zenmuse L2 is well suited to corridor mapping, powerline surveys, earthworks, vegetation encroachment, quarry faces and complex industrial environments. It is particularly effective where vegetation obscures the ground or where conventional photogrammetry struggles with uniform, reflective or low-texture surfaces.

    For inspection teams, the practical value lies in what the point cloud can answer. You can measure distances between conductors and vegetation, calculate volumes, identify encroachments, create sections through embankments or record the position of inaccessible structural elements. LiDAR also supports repeatable comparison when a baseline survey is available.

    LiDAR is not automatically the best answer for every asset. It carries a higher investment in equipment, mission planning and data processing, and its output requires competent registration, classification and quality assurance. If the requirement is simply to identify cracked render or a missing roof tile, high-resolution RGB imagery will usually provide a faster and more economical result. Where the requirement is CAD-ready geometry or a reliable 3D record, LiDAR becomes considerably more persuasive.

    Multispectral payloads for vegetation and land condition

    Multispectral cameras capture reflected light beyond the visible spectrum, helping teams assess vegetation condition over large areas. They are commonly used for agriculture, environmental monitoring, forestry and land management, but they also have inspection value around infrastructure corridors and sites where vegetation creates operational risk.

    A multispectral payload can help identify stressed vegetation, map invasive growth and prioritise ground inspection along utility routes. It is not a substitute for LiDAR where clearance measurement is required, nor is it the best tool for structural defects. Its strength is the consistent identification of vegetation patterns that may not be obvious in standard RGB imagery.

    Gas detection payloads for specialist industrial work

    Gas detection payloads are designed for tightly defined industrial applications, including methane detection around oil, gas and energy infrastructure. They can allow teams to survey potentially hazardous areas without placing personnel in close proximity to suspected leaks.

    These sensors should be selected only after confirming sensitivity, detection distance, environmental limitations and reporting requirements. Wind conditions, gas concentration and flight profile have a direct effect on results. For most general inspection programmes, thermal, zoom and LiDAR payloads will deliver broader value, while gas detection is a specialist addition for operators with a clear use case and trained personnel.

    Match the payload to the required deliverable

    The most efficient procurement decision starts at the end of the workflow. Ask whether the output needs to be a visual report, annotated thermal images, a maintenance priority list, an orthomosaic, a 3D mesh, a classified point cloud or measured CAD data. Each output places different demands on the sensor, aircraft, GNSS correction service and processing software.

    A visual and thermal report may be produced quickly from an enterprise inspection drone with the right flight procedure. A survey-grade point cloud requires more than a LiDAR sensor: it also needs suitable RTK positioning, control methodology where appropriate, accurate trajectory processing and a quality-assured data workflow. The payload is one element of a complete system.

    Platform compatibility also matters. Larger enterprise aircraft such as the DJI Matrice 350 RTK support interchangeable payloads and are often the right choice for organisations managing varied inspection programmes. A single platform can carry thermal, zoom, LiDAR or photogrammetry sensors as requirements change. This flexibility improves long-term capability, although it comes with higher training, transport and operational demands than a compact drone.

    Inspection factors that affect payload performance

    Payload specifications should be assessed against real operating conditions, not only brochure figures. Flight endurance falls when carrying heavier sensors, operating in cold weather or flying in wind. Zoom images may be affected by haze, vibration and poor light. Thermal results can be misleading when an asset is wet, sun-heated or viewed at an unsuitable angle.

    For survey and LiDAR work, GNSS reliability is equally relevant. Sites near buildings, structures, woodland or steep terrain may experience satellite obstruction and multipath effects. An RTK workflow, suitable correction service and a sensible approach to control points help maintain confidence in positional results.

    Data volume is another commercial consideration. A short thermal inspection can produce a manageable set of images. A LiDAR or high-resolution photogrammetry mission can generate substantial datasets that require storage, capable processing hardware and trained staff. Teams should budget for the complete workflow, including processing time and deliverable review, rather than only the aircraft and sensor.

    Choosing a system that will remain useful

    The best drone payload is rarely the one with the longest specification sheet. It is the one that produces reliable information for a defined maintenance, survey or compliance decision at a sensible cost per inspection.

    For broad asset-condition work, thermal and optical zoom capability is often the strongest first investment. For measurement-led projects, terrain, corridor and 3D modelling work, LiDAR or a high-resolution photogrammetry payload may provide more lasting value. Organisations with mixed requirements should consider an enterprise platform that can accept several payloads as their inspection programme develops.

    LiDAR Tech UK can help teams assess aircraft, payload, RTK and processing requirements together, with equipment supply, training and project support aligned to the required data outcome. A practical demonstration using your own asset type is often the clearest way to confirm whether a payload will produce the evidence your inspection programme needs.

  • How to Process LiDAR Survey Data Accurately

    How to Process LiDAR Survey Data Accurately

    A LiDAR survey is only as useful as the data delivered at the end of the workflow. A dense point cloud may look impressive, but it cannot support design, quantities, asset decisions or measured drawings until it has been correctly referenced, cleaned, classified and checked. Knowing how to process LiDAR survey data is therefore as important as selecting the scanner, drone or GNSS equipment used in the field.

    The right process depends on the capture method and required output. A mobile mapping scan of a road corridor, a terrestrial scan of an industrial structure and a drone LiDAR survey of a woodland site each create different processing challenges. The common objective is the same: produce an accurate, traceable dataset that is suitable for its intended use.

    Start with the required deliverable

    Processing should begin before files are imported. Define what the client, designer or asset team needs to receive. This might be a classified LAZ point cloud, a ground model, contours, a CAD drawing, a mesh model, stockpile volumes or a set of measured sections.

    This decision controls the processing tolerance. A planning-level terrain model does not need the same level of feature extraction as a detailed as-built survey. Likewise, a visually convincing mesh is not automatically appropriate for dimensional verification. Establish the required coordinate reference system, vertical datum, accuracy specification, survey boundary and exclusion areas at the outset.

    For UK projects, this commonly means confirming whether deliverables are required in OSGB36 / British National Grid and the relevant orthometric height datum. Confusion between ellipsoidal heights captured by GNSS and project levels can introduce significant vertical errors. Apply the correct geoid model and document the transformation used.

    Import and protect the source data

    Retain the original raw data in a controlled project folder before any processing begins. This includes LiDAR files, trajectory data, GNSS observations, IMU records, base-station files, photographs, control coordinates and field notes. Raw data is the audit trail if a question arises later about coverage, accuracy or a processing decision.

    Import the scan data into the chosen processing software in its native format where possible. LAS and LAZ are widely used for point-cloud exchange, while E57 is common for terrestrial laser scanning. Keep a clear naming convention for survey dates, scanner positions, flight lines and processing versions. On larger schemes, a small amount of file discipline prevents costly confusion when data is revisited months later.

    At this stage, inspect basic survey completeness. Check that all planned scan positions or flight lines are present, that no files are corrupt, and that the point density and coverage broadly match the site conditions. It is better to identify a missed area before processing time is spent on a model that will need to be remade.

    Georeference the survey correctly

    Georeferencing places the point cloud in the project coordinate system. The method depends on the equipment and survey approach. Terrestrial scanners may use surveyed targets, cloud-to-cloud registration, or a combination of both. Mobile and UAV LiDAR systems usually rely on GNSS and IMU data, supported by RTK, PPK processing or ground control.

    For GNSS-enabled workflows, review the correction source, base-station coordinates, observation quality and any reported fixed or float solutions. A fixed RTK status alone is not proof that the final point cloud meets specification. Obstructions, multipath, poor satellite geometry and an unsuitable control setup can still affect results.

    Where targets or control points are used, compare the measured point-cloud coordinates against independently surveyed coordinates. Distribute control across the site rather than concentrating it in one convenient location. Control should represent the full working area, including changes in elevation where relevant.

    Registration and strip alignment

    Registration aligns individual scans or LiDAR strips into one coherent cloud. Software can achieve close-looking overlaps while still leaving local error that matters for survey work. Inspect hard edges, building corners, kerbs, rails and other defined features in overlap zones. These reveal misalignment more clearly than vegetation or uneven ground.

    For UAV and mobile LiDAR, review strip alignment across parallel runs and at cross-lines where available. Systematic offsets may indicate trajectory issues, timing errors, IMU calibration problems or weak GNSS performance. Do not conceal these problems by applying broad adjustments without understanding their source.

    Clean the point cloud without removing evidence

    Raw LiDAR data contains more than the site. It can include passing vehicles, people, birds, rain artefacts, reflective surfaces, scanner noise and points beyond the useful survey area. Cleaning removes points that compromise the output while preserving data that may be needed for validation.

    Use a combination of automated filters and manual review. Automated noise filters are efficient, but aggressive settings can remove legitimate narrow features such as overhead wires, fence posts, sign supports and kerb edges. This is particularly relevant for utilities, rail, highway and asset-inspection surveys, where small objects may be the reason for commissioning LiDAR in the first place.

    Clip the cloud to the agreed site boundary only after confirming that no contextual data is needed outside it. A modest buffer can be useful for drainage assessment, earthworks design and modelling of site access routes.

    Classify points for the intended analysis

    Classification separates points into meaningful groups, such as ground, vegetation, buildings, roads, water, vehicles and infrastructure. It turns a large collection of measurements into a dataset that can be analysed and modelled efficiently.

    Ground classification is often the critical stage. The algorithm identifies the likely terrain surface by assessing local elevation changes, slopes and point relationships. It performs well on open ground, but can struggle around retaining walls, steep banks, dense undergrowth, spoil heaps and built-up areas. Parameters should be suited to the terrain rather than applied as a default across every project.

    Review the ground class closely at breaklines and abrupt level changes. If building points are incorrectly retained as ground, the resulting digital terrain model can create false high areas. If genuine ground is removed beneath low vegetation, the terrain model may be incomplete. In forestry, LiDAR penetration can provide valuable terrain coverage under canopy, but results depend on sensor specification, flying height, pulse density and the density of the vegetation itself.

    Build the right surface model

    A digital terrain model represents bare earth using ground-classified points. A digital surface model includes the visible upper surface, such as buildings, trees and vehicles. Neither is universally better; the appropriate model depends on the task.

    Use a terrain model for cut and fill calculations, drainage studies, route design and contours. Use a surface model for canopy height, visibility work, roof analysis and broad site context. Grid resolution should reflect point spacing and required accuracy. An overly fine grid can imply detail that the source survey does not support, while an overly coarse grid can smooth out operationally significant features.

    Check accuracy before creating final outputs

    Quality assurance should be a formal stage, not a quick visual check at the end. Compare independent check points to the final cloud or derived surface, rather than only assessing the control that was used to constrain the survey. Record horizontal and vertical residuals, along with the method used to obtain them.

    A practical QA review should confirm four areas:

    • coordinate system, datum and units are correct;
    • coverage meets the agreed survey extent;
    • point-cloud registration and strip alignment are within tolerance; and
    • independent check points support the stated accuracy.

    Also examine the dataset at the scale at which it will be used. A cloud that appears clean when viewed across an entire site may show duplicated façades, noisy edges or gaps when a designer zooms into a kerb line or steel connection. Accuracy, precision and point density are related but different measures. High point density does not correct poor georeferencing.

    Produce CAD-ready and analysis-ready deliverables

    Once the cloud has passed QA, export only the formats and layers required for downstream use. A classified LAZ file is efficient for archiving and specialist analysis. CAD users may need extracted linework, breaklines, contours, sections or an agreed surface format. Asset teams may require a registered point cloud, panoramic imagery and clearly identified features for inspection planning.

    Avoid supplying an unstructured, multi-gigabyte point cloud as the only deliverable unless that has been specifically requested. It transfers the processing burden to the client and may be impractical for their software or hardware. Clear layer naming, sensible clipping, a coordinate statement and a concise survey report make data easier to use and defend.

    For repeat surveys, use the same control strategy, coordinate system, classification rules and reporting method where possible. Consistency makes change detection, stock monitoring and asset comparison far more reliable.

    LiDAR Tech UK can support the full workflow, from selecting capture equipment and GNSS corrections through to processing and survey deliverables. The best result is not simply a detailed point cloud; it is dependable spatial information that your project team can use with confidence.

  • Inspection Drones for Infrastructure Projects

    Inspection Drones for Infrastructure Projects

    A bridge inspection delayed by lane closures, a wind turbine accessible only by rope team, or a transmission tower standing within a live network all present the same operational problem: the asset needs close, defensible inspection data without putting people in unnecessary danger. Inspection drones for infrastructure give asset owners a practical way to capture that evidence faster, more frequently and with far less disruption than many conventional access methods.

    For UK infrastructure teams, the benefit is not simply aerial imagery. A properly specified enterprise drone workflow can produce repeatable, geo-referenced records for condition assessment, maintenance planning, engineering review and audit trails. The value comes from matching the aircraft, sensor, positioning method and data output to the inspection decision that follows.

    Where infrastructure drone inspections add value

    Drone inspection is especially effective where access is difficult, risk is high or the cost of downtime is significant. Utilities, highways, rail-adjacent assets, industrial estates, ports, quarries and renewable energy sites all contain structures that are expensive to reach by scaffold, cherry picker, rope access or manned aircraft.

    A drone can document façades, roofs, stacks, bridges, retaining walls, pylons, cooling towers and drainage assets from safe stand-off distances. It can also survey broad corridors and sites between detailed inspections, helping teams identify change, vegetation encroachment, drainage issues or surface deterioration before sending people to investigate further.

    This does not mean drones replace every close-up inspection. Where an engineer needs to touch a component, take a material sample, test a connection or assess an area hidden behind a cover, physical access remains necessary. The strongest operational model is often drone-first: use aerial data to prioritise access work, define the scope precisely and avoid sending specialists to defects that do not require intervention.

    Choose the sensor around the defect, not the aircraft

    The most common procurement mistake is choosing a drone by headline flight time or camera resolution alone. For infrastructure work, the correct starting point is the defect or measurement requirement. A high-resolution visual camera is excellent for general condition records, concrete spalling, corrosion, loose fittings and visible cracking where the aircraft can safely get close enough. Optical zoom adds value on tall structures or in exclusion zones, allowing detail to be captured without compromising stand-off distance.

    Thermal imaging serves a different purpose. It can highlight temperature variation associated with electrical faults, insulation failures, solar-panel anomalies, heat loss or moisture-related issues. Thermal findings need experienced interpretation and appropriate environmental conditions. Reflections, solar loading, wind and changing surface temperatures can all affect the result, so a thermal image should be treated as inspection evidence rather than an automatic diagnosis.

    LiDAR is particularly useful when the required output is accurate 3D geometry. It can capture complex structures, corridors and vegetation-affected environments, producing point clouds that support clearance assessment, volumetric analysis, digital twins and change detection. Unlike photogrammetry, LiDAR does not rely on visible texture in the same way, although its accuracy still depends on sensor calibration, flight planning, GNSS conditions and control.

    Photogrammetry remains a highly capable option for detailed orthomosaics and textured 3D models. With sufficient image overlap, stable lighting and sound ground control, it can create useful survey-grade deliverables. It is often more economical than airborne LiDAR for large, open and visually detailed surfaces. The choice depends on the required tolerance, surface type, vegetation cover and the software workflow used by the engineering team.

    Positioning and repeatability determine whether data can be compared

    A single inspection can identify an obvious fault. The longer-term advantage comes from comparing inspection datasets over time. To do this reliably, image positions and 3D datasets need consistent spatial reference.

    RTK-enabled enterprise drones can improve positional accuracy by applying real-time corrections from a base station or network correction service. For many projects, this reduces the time required to establish conventional ground control and strengthens the location confidence of collected imagery. It does not eliminate the need for verification. On high-accuracy work, independent check points, a documented coordinate system and clear processing controls remain essential.

    Repeatability also depends on flight design. Teams should record stand-off distance, camera angle, focal length, altitude, overlap and inspection route, rather than relying on a pilot to recreate a previous flight from memory. Repeat missions around a bridge bearing, tower face or rooftop plant area should use the same inspection geometry wherever practical. Consistent capture makes change easier to detect and reduces ambiguity in engineering review.

    Accuracy should be specified in the final deliverable

    It is useful to separate aircraft positioning accuracy from the accuracy of the final model, measurement or defect location. GNSS performance, image quality, surface geometry, control points and processing settings all contribute. A project brief should state what is required: for example, a visual report with defect locations, a scaled orthomosaic, a classified point cloud, a CAD-ready model or a measured clearance survey.

    Without that definition, teams can collect impressive-looking data that does not answer the maintenance question. A professional workflow begins with the output, then specifies capture and processing to achieve it.

    Plan the operation as carefully as the flight

    Infrastructure environments create constraints that consumer-drone workflows are not designed to manage. Live substations, operational railways, public highways, industrial traffic, confined spaces, cranes, turbines and high winds require structured planning. The pilot must understand airspace, site hazards, electromagnetic interference, take-off and landing options, lost-link procedures and safe separation from people and assets.

    UK operators must also meet Civil Aviation Authority requirements applicable to the aircraft, operation and location. Depending on the proposed flight, this may involve defined competency, operational procedures, permissions or an Operational Authorisation. Clients should expect suitable risk assessments, method statements, insurance and records of pilot competence as part of a professional inspection mobilisation.

    Weather deserves more than a basic wind-speed check. Gusts around structures, rotor wash near walls, rain, low light, thermal contrast, cloud cover and sun angle can all determine whether a capture is safe and technically useful. A thermal survey planned for the wrong time of day can be less valuable than no survey at all. A visual inspection of a west-facing façade may need to avoid glare, while a LiDAR mission may require a different approach to manage occlusion.

    Turn drone capture into an asset management record

    Infrastructure managers do not need thousands of unstructured images handed over at the end of a flight. They need information that can be reviewed, assigned and compared. That may be a defect register with annotated photographs, a georeferenced map, a 3D point cloud, a mesh model, a thermal report or a set of CAD-compatible measurements.

    The right deliverable depends on the organisation’s existing systems. A highways contractor may need chainage-referenced imagery and dimensions. A utility provider may require asset IDs, coordinates and thermal anomalies in a standard inspection template. A civil engineering consultant may need point clouds and mesh data for design coordination. Establishing naming conventions, coordinate reference systems, file formats and acceptance criteria before fieldwork prevents expensive reprocessing later.

    Data governance also matters. Critical infrastructure imagery may be commercially sensitive or subject to site-specific security controls. Confirm where data will be stored, who can access it, how long raw files are retained and whether processing will take place within an approved environment. These considerations should sit alongside resolution and accuracy in the procurement discussion.

    Build the right capability model

    Some organisations benefit from owning an enterprise drone system and training their own team. This approach suits frequent, repeatable inspections where local staff can mobilise quickly and where a clear internal operating procedure can be maintained. Ownership should include more than the aircraft: batteries, charging and transport arrangements, RTK corrections, software licences, maintenance, pilot training, operational documentation and data-processing capacity all need to be budgeted.

    For periodic, technically complex or higher-risk work, an outsourced service can be more efficient. It provides access to experienced pilots, survey control, specialist sensors and established processing workflows without creating an internal compliance burden. A hybrid approach is also common: an in-house team captures routine visual checks, while specialist providers support LiDAR surveys, thermal programmes, complex airspace or engineering-grade deliverables.

    LiDAR Tech UK supports both routes, supplying enterprise drone and positioning systems alongside training, technical support, data processing and field services. The key is to choose a capability model that supports the inspection frequency, accuracy requirement and internal resource available – not simply the lowest initial equipment cost.

    A better question for procurement teams

    Rather than asking which drone is best, ask which inspection decision needs to be made faster and with greater confidence. That question clarifies the sensor, the accuracy, the operating model and the deliverable. When the workflow is designed around a real asset-management decision, drone data becomes a reliable maintenance tool rather than a collection of aerial photographs.

  • Best Software for Point Cloud Processing

    Best Software for Point Cloud Processing

    A point cloud can be captured in hours yet lose value quickly if registration is unstable, noise is left unresolved or the final model cannot move into the client’s CAD, BIM or asset-management workflow. The best software for point cloud processing is therefore not simply the package with the longest feature list. It is the one that produces dependable, usable deliverables at the required accuracy and within the time available.

    For UK survey, construction, infrastructure and inspection teams, software selection should begin with the outcome: a registered scan set, a classified terrain model, measured as-built information, a mesh for visualisation, or drawing-ready geometry. The right answer varies according to capture method, point-cloud size, required tolerances and the experience of the people processing the data.

    What point cloud processing software must do

    A professional workflow normally starts by importing LiDAR, terrestrial laser scan, mobile mapping or photogrammetry data. The software then aligns individual scans or trajectories, applies control where required, removes unwanted data, checks quality and exports a format suitable for downstream design or analysis.

    Registration is usually the critical stage. Target-based registration can provide clear auditability on controlled survey work, while cloud-to-cloud registration can reduce field setup time on complex interiors or large sites. Neither removes the need for sound survey control, sensible overlap and a documented accuracy check. Software can refine good data; it cannot reliably recover information that was never captured.

    Processing requirements then diverge. A highways survey may need ground classification and a clean digital terrain model. A building retrofit project may require a coordinated point cloud for Revit or AutoCAD workflows. An industrial inspection may demand high-detail meshing, measurement and colour imagery. Teams should avoid buying a platform designed around one task and expecting it to perform every specialist function equally well.

    Best software for point cloud processing by workflow

    Leica Cyclone REGISTER 360 PLUS

    Leica Cyclone REGISTER 360 PLUS is a strong choice for teams processing terrestrial laser-scanner data where efficient registration, visual quality checking and a clear project record matter. Its guided workflow is particularly useful when multiple operators need consistent results across building, plant and infrastructure surveys.

    The principal benefit is speed from field capture to a registered deliverable. Visual alignment tools and automated registration can reduce manual effort, but surveyors should still review constraints, residuals and control results before issue. It is best suited to organisations already operating within a Leica scanning ecosystem or regularly handling scan-intensive reality-capture projects.

    Its trade-off is commercial and operational: it is a specialist professional platform, so it makes most sense where scan registration is a regular, billable activity rather than an occasional requirement.

    Trimble RealWorks

    Trimble RealWorks is designed for survey and engineering workflows that require more than basic registration. It supports point-cloud processing, inspection, modelling and deliverables for construction, industrial and infrastructure applications. It is particularly relevant where data must be connected to established Trimble field and office processes.

    For teams creating as-built documentation, extracting geometry or checking construction against design, RealWorks offers capable tools without forcing every project into a general-purpose CAD workflow first. The practical consideration is training. Its capability is substantial, but users obtain better results when templates, export standards and quality-control procedures are agreed before projects begin.

    FARO SCENE

    FARO SCENE remains a practical registration and processing environment for FARO laser scanner users. It is well suited to organisations capturing building interiors, heritage sites, industrial facilities and construction progress data, particularly where automated registration can accelerate routine processing.

    The software performs best when field crews follow a repeatable capture plan with adequate overlap and appropriate targets or reference objects. It is not a replacement for survey control on work with defined coordinate and accuracy requirements. Where deliverables extend to modelling, CAD extraction or advanced analysis, SCENE is often part of a wider software chain rather than the only platform required.

    Autodesk ReCap Pro

    Autodesk ReCap Pro is often the sensible choice for project teams that need to bring registered point clouds into Autodesk design workflows. Its value lies in making reality-capture data accessible for AutoCAD, Revit and Civil 3D users who need context for design, coordination and measured verification.

    It is less suited to being the primary processing environment for complex, raw multi-scan datasets. A survey team may register and validate data in scanner-specific software, then use ReCap Pro to distribute, crop and prepare files for design colleagues. This division of labour can be efficient, provided file naming, coordinates and revision control are managed carefully.

    CloudCompare

    CloudCompare is a capable open-source option for visualisation, segmentation, comparison, distance analysis and point-cloud cleaning. It can be valuable for technical users who need to inspect data, compare epochs or carry out specific analytical tasks without adding another high-cost licence.

    Its limitation is not capability but workflow support. CloudCompare is less structured than commercial enterprise platforms and relies more heavily on user knowledge. It may be an excellent secondary tool for experienced geospatial professionals, but it is rarely the best sole platform for a business that needs repeatable reporting, vendor support and straightforward handover between staff.

    TerraScan and TerraModeler

    For airborne and mobile LiDAR projects, TerraScan and TerraModeler remain respected specialist tools for classification and terrain extraction. They are highly relevant to corridor mapping, forestry, utilities, flood-risk modelling and large-area topographic work where ground filtering and class accuracy determine the value of the final dataset.

    These tools reward experienced operators. Automated classification routines can be configured effectively, but vegetation, overhead lines, complex structures and variable terrain still require inspection and manual refinement. They are not aimed at a simple indoor scan-registration workflow; their strength is detailed geospatial processing at scale.

    Select software around the deliverable, not the scanner

    A scanner purchase should not dictate every office decision. Whether data comes from a terrestrial system, a wearable mobile mapper, an RTK-controlled drone or a vehicle-mounted platform, the required deliverable should determine the processing path.

    For survey-grade topographic output, prioritise coordinate-system handling, control adjustment, classification tools and exports that work cleanly in CAD and GIS. For building surveys, prioritise registration confidence, clipping, measurement, panoramic imagery and compatibility with BIM tools. For asset inspections, look for annotation, repeatable measurement, mesh generation and comparison tools that make change visible to engineering teams.

    Also consider point-cloud volume. A small internal survey can be managed on a standard workstation, while multi-day mobile mapping or high-density terrestrial scanning projects may require substantial RAM, fast storage and a dedicated graphics card. The cost of inadequate hardware is often measured in lost processing time and failed exports, not just slower rendering.

    Questions to ask before committing

    Before selecting a package, establish whether it can import your native scan or trajectory files without a slow conversion step. Confirm how it handles UK National Grid, local site grids and survey control. Ask what quality report can be produced, how licences are structured, whether processing can be repeated by another operator and which export formats your clients actually accept.

    It is also worth testing a real project rather than a clean demonstration dataset. Include reflective surfaces, vegetation, tight interiors, low-overlap areas or long corridors if those conditions are typical of your work. A trial should prove registration quality, processing time and the final handover format, not just confirm that the software opens a file.

    Build a dependable processing workflow

    The most effective software environment is usually a controlled combination: capture software for import and registration, a specialist tool for classification or analysis where needed, and design software for final coordination. Attempting to force every job through one package can create bottlenecks and reduce traceability.

    LiDAR Tech UK can help organisations match LiDAR capture hardware, processing software and practical training to the required survey or inspection output. The aim is a workflow that field teams can operate confidently and office teams can verify, repeat and deliver.

    Choose software that makes accuracy visible rather than assumed. When registration checks, coordinate control and export requirements are agreed before the first scan is taken, point-cloud data becomes a dependable project asset rather than another large file waiting to be processed.

  • A Point Cloud Registration Workflow That Works

    A Point Cloud Registration Workflow That Works

    A point cloud registration workflow is where a fast LiDAR capture either becomes dependable survey information or remains a collection of impressive-looking scans. The scanner may collect millions of points in minutes, but every scan position, trajectory segment and reference target must resolve into one coherent coordinate system before the data can support design, measurement or asset decisions.

    For UK survey, construction and infrastructure teams, registration is not simply a software task completed at the end of the day. It begins with planning the survey control, choosing sensible scan positions and ensuring enough overlap exists to constrain the final model. A well-planned workflow reduces office processing time, limits revisits and gives clients confidence that the deliverable can be used in CAD, BIM, GIS or inspection reporting.

    What registration must achieve

    Registration transforms separate point clouds into a single spatial dataset. Depending on the method, scans are aligned using common geometry, artificial targets, GNSS positions, SLAM trajectory data, surveyed control or a combination of these methods. The objective is not merely to make the dataset look aligned. It is to quantify, manage and document the accuracy of that alignment.

    The required result depends on the application. A rapid internal stockpile model may tolerate lower relative accuracy than a measured building survey or clash-sensitive retrofit scheme. A mobile mapping survey of a long highway corridor introduces different challenges again, including GNSS availability, trajectory drift and repeated visual features. The registration method should therefore follow the required deliverable accuracy, site conditions and available control, rather than the scanner specification alone.

    Relative accuracy and absolute accuracy should be considered separately. Relative accuracy describes how well scans fit one another within the point cloud. Absolute accuracy describes how well the completed cloud relates to the project grid, national grid or site control. A dataset can have excellent internal alignment while still being incorrectly positioned if the control has been entered, observed or transformed incorrectly.

    Plan control before the first scan

    Control is the foundation of a defensible registration. Before mobilisation, establish the coordinate reference system, vertical datum, project origin and required output format with the client or design team. On construction projects, confirm whether the contractor’s local grid is to be used and verify how it relates to OS National Grid and Ordnance Datum Newlyn where relevant.

    Control points should be stable, accessible and distributed across the survey area. Concentrating all control at one end of a site can produce a good local fit while allowing error to grow across the rest of the dataset. For a building, control around the perimeter and across different levels provides a stronger solution. For a linear asset, use suitable spacing along the route and allow for independent check points.

    GNSS/RTK can establish efficient control in open environments, provided correction availability, satellite visibility and multipath risk are assessed. In urban streets, beneath structures or within dense woodland, a total station traverse or closed control network may be more appropriate. The practical choice depends on the environment. The key requirement is traceable, verified coordinates rather than assuming an RTK fix alone is sufficient.

    Artificial targets remain valuable where high confidence is required. Spheres, chequerboard targets and surveyed marks give the registration software clear common features, particularly in areas with limited geometry such as long corridors, plain walls or repetitive industrial interiors. Targets must be visible from multiple scan positions and set where they cannot be disturbed by site activity.

    Capture for overlap, not just coverage

    A scan plan should create overlap deliberately. Coverage answers whether every required surface has been observed. Overlap answers whether the software has enough shared geometry to align adjoining scans reliably. These are related, but they are not the same.

    For static terrestrial scanning, each new scan should see a meaningful portion of the preceding scan and, where possible, connect to more than one neighbouring position. This creates loops in the network. Loops are useful because they expose cumulative error rather than allowing a chain of scans to drift unnoticed from one end of a structure to the other.

    Feature-rich areas generally register well using cloud-to-cloud alignment. Corners, structural steel, plant, façade detail and varied ground surfaces provide useful geometry. Large open floors, uniform tunnels, glazed elevations and repetitive racking need more care. Add targets, shorten scan spacing or introduce surveyed control before leaving site. Waiting until processing to discover weak constraints is an expensive way to find a problem.

    For mobile or SLAM LiDAR capture, maintain a measured route with repeated observations of stable features. Avoid moving too quickly through areas with minimal texture or geometry, and close loops where the system and survey plan allow. Trajectory quality can deteriorate during abrupt movement, dense crowds, reflective surfaces or lengthy sections with few defining features. A controlled walking route often produces a more useful result than simply collecting data at maximum speed.

    The point cloud registration workflow in the office

    Begin by organising raw data before alignment. Retain original files, field notes, control observations, target records and photographs in a structured project folder. Clear naming by date, area, floor or scan station prevents confusion when revisions are required months later. This matters especially when a survey combines terrestrial LiDAR, mobile scanning, drone photogrammetry and GNSS observations.

    The initial registration normally uses scanner positions, targets or trajectory information to create a first-pass alignment. Automatic cloud-to-cloud methods can then refine the fit by matching shared surfaces. Automation is efficient, but it should not be treated as proof. Algorithms can produce a mathematically acceptable result from the wrong correspondence, particularly where the site contains repeated bays, identical columns or similar façades.

    Apply surveyed control after the initial network has formed, then review how the transformation affects residuals across the project. A constrained adjustment may improve absolute position but reveal weak scan geometry that a free registration concealed. Where residuals are high, investigate the cause rather than forcing the fit by accepting poor targets or altering coordinates without evidence.

    It is often useful to keep two versions during processing: a free or locally registered cloud for diagnosing internal fit, and a controlled cloud for deliverables. Comparing the two helps separate an internal registration issue from a control issue. This is particularly useful on complex sites where several teams have contributed field data.

    Quality assurance that stands up to scrutiny

    Registration reports should be read in context. A low overall error figure is useful, but it is an average and can hide local misalignment. Review residuals at control points and targets, then inspect cloud sections through critical features such as wall junctions, kerb lines, rail heads, structural connections and service runs.

    Independent check points are stronger evidence than points used to constrain the solution. They should not be included in the adjustment. Comparing their observed and cloud-derived positions provides an honest measure of how the final point cloud performs in the project coordinate system.

    Visual checks also matter. Examine overlap zones using intensity, colour or point-to-point distance tools. Look for doubled edges, split lines, ghosting around columns and stepped surfaces. These defects can be small in a full-site view but become significant when extracting dimensions or modelling interfaces.

    Document the final registration method, control used, coordinate system, residuals, check results and any limitations. If an area was captured with lower density, had restricted access or contains moving objects, record it. Clear metadata allows the client’s design, engineering or asset team to understand what the data supports and where care is required.

    Clean only after alignment is trusted

    Noise removal, decimation and classification should follow registration checks, not replace them. Removing temporary objects and isolated points makes the cloud easier to use, but aggressive filtering can erase evidence of misalignment or remove detail required for modelling. Keep an untouched registered master dataset and create derivative files for specific purposes.

    Choose export formats around the downstream task. A CAD team may require a clipped, decimated cloud with a suitable project origin. A BIM modeller may need segmented areas and consistent level naming. An asset inspection team may benefit from high-resolution imagery, annotated viewpoints or classified objects. Delivering one massive generic file can shift unnecessary processing effort to the client and reduce the value of the survey.

    A dependable workflow combines suitable LiDAR hardware, sound survey control and disciplined QA. LiDAR Tech UK supports teams with scanning technology, GNSS/RTK positioning and practical processing expertise, helping match the registration approach to the accuracy, environment and output your project requires. The most useful point cloud is not the one with the highest point count – it is the one whose position, accuracy and limitations are understood well enough to make decisions from it.